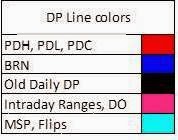
I am not a certified analyst. The charts shown and the content in the blog are for educational purpose only and in no way is a buy or sell recommendation. Readers are advised to use discretion.

Tuesday 31 December 2013

Intraday Trades - 31.12.2013

Intraday: Market was in 12 pt range today. took many trades-
1) Short on Initial candle cross with selling pressure. Got 10 pts. Mkt was looking bearish & i was expecting it to move till PDC. The big Green Engulfing candle made me out.
2) Short again on Hammer on UBB & day's high. Though signal wasn't perfect for me, but still got 6 pts. Mkt was too slow on downside, so looked for Longs..
3) Long on BOF on LBB & lower range. Out at no loss. Mkt wasn't moving anywhere so was thinking of avoiding further trades.
4) Long again on BOF of LBB & Range low.Signal looked very promising to me with Ranging BB. Was Out with 6 pts only.

Monday 30 December 2013

Intraday Trades - 30.12.2013

Positional: I am Bearish since 27th. Planning to initiate a positional short near NF 6280.
Intraday: Market was looking bullish before start, as suggested by SGX nifty, but the 1st candle broke the PDH downwards.
1) Shorted on the break of 5 min candle. was expecting it till close, but market didn't gave any opportunity to come out. Close at first green candle.
2) Another short, when market gave a BOF & a shooting star near UBB. only 5 pts
3) Long on the BOF of day's low with a Tag on LBB. closed at no loss.
The last short trade didn't give any reliable signal to enter.. I was expecting an upmove with the Big Red Hammer on LBB, so was ready to buy above that, but market moved downwards.


Friday 27 December 2013

Intraday trades - 27.12.2013

Intraday: I was having a Bearish stance today, but market just ran at the open & i couldn't trade the initial breakout. Tried below trades-
1) Short on the BOF of the Range. SL hit
2) Short again when price denied to move above day's high. Exit at no loss.


Thursday 26 December 2013

Intraday Trades - 26.12.2013

Intraday: Today Being Expiry day, I was planning to trade in the morning session only. The market was dull in the morning & gave 2 opportunities. Refrained from Trading in the end.
My Charts on Investing.com were not working, so used Google today (I Don't like IIFL charts, the terminal I have)
1) Long on the Hammer at LBB. Exit at UBB
2) Short on the shooting star/ Hammer at UBB + BOF of Day's high. Closed when it refused to go below yesterday's close in 2nd attempt.


Tuesday 24 December 2013

Intraday Trades - 24.12.2013

Intraday: As tomorrow is holiday & then expiry, i had a Bearish bias..
1) Didn't attempt 1st & 2nd BOF as all the DP were just above & i was bearish.
2) Attempted BOF of range high. Closed at Range low.
3) Another short at the pullback on the range low. SL hit
No further trade..

Monday 23 December 2013

Intraday Trades - 23.12.2013

Intraday: Today, Market gap up & I was expecting it to fill the gap. Chopped Badly & Traded too much.. will refrain from it tomorrow.
1) Long on the BOF of range low & LBB. 7 pts only.
2) Long again on the candle after pullback. SL hit
3) Short on the BOF on big red candle. Out at No loss.
4) Long again on pullback after breakout. Out at the shooting star on UBB
5) Short on same Shooting star. Didn't sit with full move & got out with 7 pts again

Friday 20 December 2013

Intraday Trades - 20.12.2013

Intraday: Didn't attempt the morning trade due to 1st candle as inverted hammer. But after 11:00, took 2 Longs today:
1) Long on the BOF of the 1st candle high with favourable BB. Got out at the hammer outside UBB, a little early.
2) Another long on the pullback on range high with close above UBB. Waited till end of the session to close.

Thursday 19 December 2013

Identify A Trend Change by Pivots

In Simple Terms, An uptrend is a series of Higher Lows (Yes, Higher Highs are not mandatory for uptrend) & a Downtrend is a series of Lower Highs in that particular Timeframe (its Important).

Here is a simple method to Identify a Trend Change in any Timeframe. Look at the Picture below:


A Downtrend is in place before the Blue line. When this Blue line breaks, Downtrend ends, but Uptrend doesn't Begin. So its a NO TRADE ZONE.
When the Price makes a new Pivot High breaking the previous Pivot High, it confirms the Uptrend

That's it. Now, if you really want to understand, Practice by looking at atleast 50 charts and see the trend change.
Remember, a chart or chart pattern will never look same as seen earlier!!

Intraday Trades - 19.12.2013

Intraday: Market moved fast in the morning due to FOMC effect. Was out of the market till 11:00 am letting it to settle down. Was not expecting too much from today's market. Took 2 trades:
1) Short at the BOF of range formed. A shooting star at UBB. A tag on LBB & went up. Closed it at no loss.
2) Short again at BOF of BRN 6200. Was expecting this trade to move beyond today's low. But again No Close below LBB, so closed it at LBB.

Wednesday 18 December 2013

Intraday trades - 18.12.2013

Intraday: Took a single trade today & was contended.
1) Long on the break of Initial Range candle. Got 24 pts at BRN. Chart made a Shooting star on LBB so was ready for that.
No signal to enter the fast move & then market remained in a range with no good signal to enter..


Tuesday 17 December 2013

Intraday Trades - 17.12.2013

Positional: Market is looking weak as was not able to sustain above 6200. RBI policy is also nearing. will not attempt any Long & will look for some shorts..
Intraday: Took one trade only as was trying to reduce my number of trades. I am trading too much from last few days.. now will focus on 2 trades max per day with High probability. (to time the market is not the idea, to stop Over-trading is)-
1) Short on the Failure to continue & break of the range with close below LBB. Keep sitting tight till market close.


Monday 16 December 2013

Intraday Trades - 16.12.2013

BB removed for better explanation of today's range..
Intraday: Market was in a good range today took all the BOF trades, but no major point earning..
1) Missed the first move marked by pink candle, as it went too fast..
2) Bought the BOF of day's low. Ended up at PDL.
3) Shorted just after getting out of long as BOF of PDL
4) Bought again at BOF of PDL.
5) Shorted again in the last expecting it to break the range low, but it stopped just there only.

Friday 13 December 2013

Got my New Car Today - Etios Liva - 13.12.2013

Hi All,

Today I got my New Car -Etios Liva in Red... Happy to say that it's funded by Trading !!

Excuse me for my bad photography. Its from my Mobile..

Thanks..

Intraday Trades - 13.12.2013

Intraday: Didn't trade today as I was out to get my New Car. Today Market open gap down & gave 3 opportunities-
1) A Hammer Long at LBB & BRN in ranging market
2) Another Hammer Long at LBB in ranging market
3) A Shooting star fro Short in ranging market. Remember we never take 1st & 2nd reversal signal, when market is Trending but Yes in Ranging..

Thursday 12 December 2013

Intraday Trades - 12.12.2013

Today was a bad day for me..
Positional: Stopped out. It was a bad judgement.
Intraday: Took 3 trades & missed the 4th important one..
1) Took a Short on BOF of Range high. Closed at range low
2) Took another short at BOF of Range high, closed at range low
3) Took a Long at range low, waited as market. waited too long and stopped out
Didn't take final trade.. .again a loss..

Wednesday 11 December 2013

Intraday Trades - 11.12.2013

Positional: Took a Long today at 6227 as the R:R seems quite good (marked with Blue arrow). 1st TGT is 6420, SL is today's Low around 6110.
The reason - BB made a Tag & then no Touch  + RSI gave Hidden Divergence & a touch at its Bull boundary - 40 in Hourly TF

Intraday: Attempted 2 trades as below-
1) Long at the BOF. The BB tag + FTC confirms the signal. Closed at Day's high. no prior trade as the RR was unfavourable, no space to move..
2) Short at the BOF. Covered at Day's low.
Was not expecting this much move in last 30 mins. Also, No reliable signal happened, so didn't take that


Tuesday 10 December 2013

Intraday Trades - 10.12.2013

Intraday: Market keep closing below LBB. Took a single trade-
1) Short on the break of range low. Covered with 20 pts

Monday 9 December 2013

Bollinger Bands (BB) - Rule 3

Third Rule of BB - Close/ Tag or No touch on BB

Ok, here comes another good rule for BB, which i use most of the time. Its a little tougher & needs practice to watch at Live market. So, keep identifying it first at daily charts- then on hourly TF & finally on hi speed 5min/ 3 min charts..

BB are nothing but the standard deviations & in Technical terms, when a process moves outside this band, it will turn to its mean IF ANY EXTERNAL INTERFERENCE forces the process. This External Interference is generally the Smart Money & it is shown by the Close / Tag or No touch on BB..

Close means, no Interference, so market will most probably continue the same direction after Pullback
Tag means, some External Interference & a pressure to not let the Process deviate the other trend
No Touch is nothing but Failure to Continue & even touch the BB, a good Pressure for Reversal.

Lets see with below example to understand all 3...

So keep looking for them and decide on the position, whether to exit or take reversal..

NB: The order should be right at a DP - 1) Close then 2) Tag and 3) FTC. Not in reverse order...

Happy Trading !!!

Glossary


Intraday trades - 09.12.2013

Positional: Market made a shooting star in hourly chart. Hesitated to go short positional today due to big gap opening. I think market has already discounted the BJP wins..

Intraday: No suitable trade today as market was in tight range on a BRN after initial move..


Saturday 7 December 2013

Download the Best Trading E-book

Hi All,

The best Trading E-book is Out !! Its the rare piece of work in its simplest form.

Newbies- Try to go through it at least 5 times,
Oldies - Go through it at least 10 times as you need to overcome the barrier of your old goodies..(indicators/ patterns)

Just understand it & if any doubt, feel free to ask...

Nifty Nirvana: Download the E-book: Finally here is the book for a weekend read.

Friday 6 December 2013

Intraday Trades - 06.12.2013

Intraday: Today's market was a good ranging market. Tried only breakout failures-
1) Short when it refused to break Round number 6300. Slowly drifted to yesterday's close for 20 pts.
2) Long on same breakout failure. Came out at no loss.
3) Again a short at 6300 for 10 pts.

Thursday 5 December 2013

Intraday Trades - 05.12.2013

Positional: Market couldn't close today above upper BB with a bearish stance. OI data is suggesting 6200 ~ 6500 as a range.. Monday's election result can have an impact on either side, will wait for that..
Intraday: Took a single trade today after gap up-
1) Short on the Breakout Pullback on the 6200. Got 20 pts.

Tuesday 3 December 2013

Intraday Trades - 03.12.2013

Starting updating daily by 6:30 as i wait for OI data from NSE for Next day Positional trades clues.. will not trade tomorrow.. see you on 5th..

Positional: Hourly chart is still looking bearish. It will most probably make a double top & will try to go short there..
Intraday: Missed the first Long completely. Also as I was Bearish for today, so took 2 shorts only-
1) Short when breakout failed on yesterday's close. Got only 14 pts..
2) Shorted again when it refused to go above the same close. Got 15 pts..

Monday 2 December 2013

Intraday Trades - 02.12.2013

Positional:  A Hanging man is formed in monthly chart. So for long term, this month closing should be above 6370.
Hourly chart preparing for a divergence so Looking to go Short positional tomorrow or day after at right price. TGT is 6000 as its a good base for Bulls now.
Intraday: Many signals were generated today. took the below trades -
1) Long on the Hammer after pullback on mid BB and yesterday's high. Closed when mkt became ranging.
2) Long again on reversal signal on BB. The market was bullish, so it was a high probability trade with TGT as upper BB/ Day's Hi.
3) Long again on the Hammer at lower BB. This ended up with my SL.
4) Final Long trade on the big hammer at Lower BB. Waited too long to get 10 pts.